Tune XGBoost Performance With Learning Curves
XGBoost is a powerful and effective implementation of the gradient boosting ensemble algorithm.
It can be challenging to configure the hyperparameters of XGBoost models, which often leads to using large grid search experiments that are both time consuming and computationally expensive.
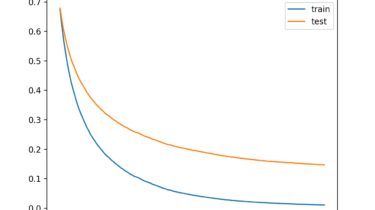
An alternate approach to configuring XGBoost models is to evaluate the performance of the model each iteration of the algorithm during training and to plot the results as learning curves. These learning curve plots provide a diagnostic tool that can be interpreted and suggest specific changes to model hyperparameters that may lead to improvements in predictive performance.
In this tutorial, you will discover how to plot and interpret learning curves for XGBoost models in Python.
After completing this