A command line tool for visualizing CSV/spreadsheet-like data
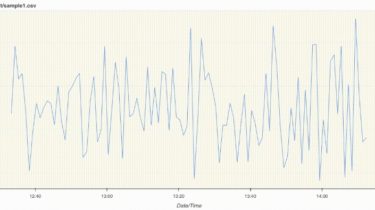
PerfPlotter Read data from CSV files using pandas and generate interactive plots using bokeh, which can then be embedded into HTML pages and served by server-client applications (or at least allow them to be viewed on a browser). Environment Python 3.8.x macOS 10.15.x Firefox 88.x Setup Clone and cd into the perfplotter directory Install dependencies $ pipenv install –dev –python=/path/to/python3.8 Install pre-commit hooks $ pre-commit install $ pre-commit run –all-files Optional: pre-commit autoupdate Activate virtual environment In the same directory […]
Read more