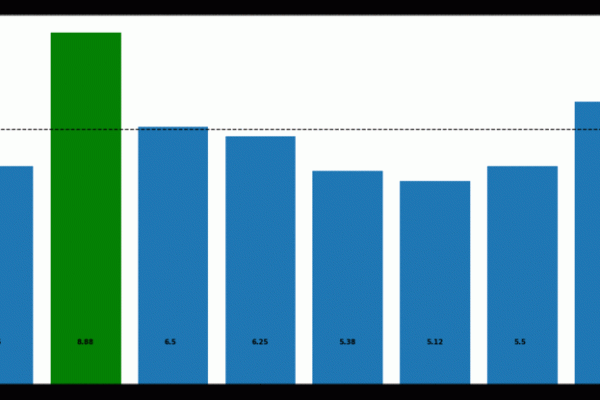
Stocks, Significance Testing & p-Hacking: How volatile is volatile?

October is historically the most volatile month for stocks, but is this a persistent signal or just noise in the data?
Stocks, Significance Testing & p-Hacking. Follow me on Twitter (twitter.com/pdquant) for more. Over the past 32 years, October has been the most volatile month on average for the S&P500 and December the least, in this article we will use simulation to assess the statistical significance of this observation and to what extent this observation could occur by chance. All code included! Originally posted here.
We will be using Daily S&P500 data for this analysis, in particular we will use the raw daily closing prices from 1986 to 2018 (which is surprisingly hard to find so I’ve made it publicly available).
The inspiration for this post came from Winton, which we will be reproducing here, albeit with 32 years of data vs their 87 years.
For those on Kaggle I’ve created an interactive Kernel — give it an upvote!
To answer the question of whether the extreme volatility seen in certain months really is significant, we