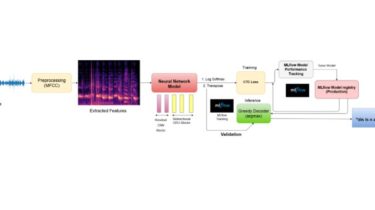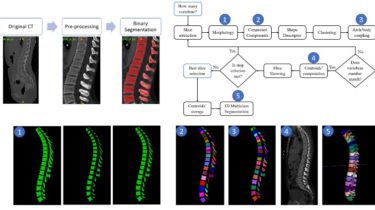
Segmentation and Identification of Vertebrae in CT Scans using CNN, k-means Clustering and k-NN
Segm_Ident_Vertebrae_CNN_kmeans_knn Segmentation and Identification of Vertebrae in CT Scans using CNN, k-means Clustering and k-NN If you use this code for your research, please cite our paper: @Article{informatics8020040, AUTHOR = {Altini, Nicola and De Giosa, Giuseppe and Fragasso, Nicola and Coscia, Claudia and Sibilano, Elena and Prencipe, Berardino and Hussain, Sardar Mehboob and Brunetti, Antonio and Buongiorno, Domenico and Guerriero, Andrea and Tatò, Ilaria Sabina and Brunetti, Gioacchino and Triggiani, Vito and Bevilacqua, Vitoantonio}, TITLE = {Segmentation and Identification of […]
Read more