Homework 2: Matplotlib and Data Visualization
Overview
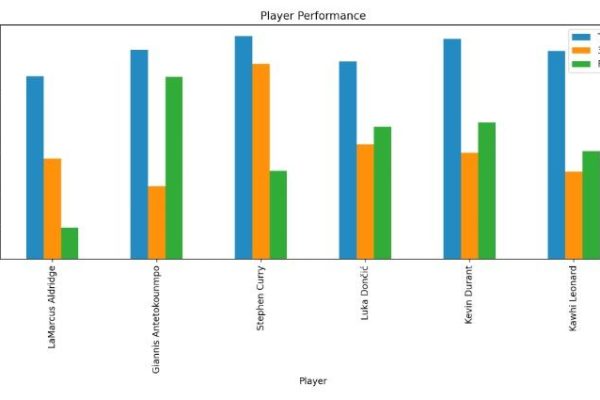
These data visualizations were created for my introductory computer science course using Python. I chose to create data visualizations on NBA players because I watched a lot of basketball with my dad growing up. The purpose of this homework assignment was to familiarize ourselves with Matplotlib and CSV files.
Five Most Common Ages of NBA Players

In this pie chart, I wanted to look into the five most common ages of NBA players. The percentages displayed on the pie chart show the percentage each age constitutes out of the five ages. It is important to note that while these percentages add up to 100%, the ages of NBA players are not contained within these