Easily visualize traffic simulations (made for the PSE course) via plain text data output
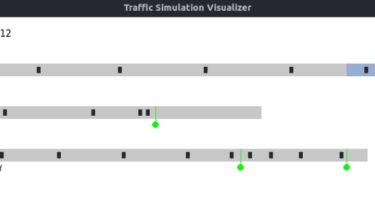
Script to easily visualize traffic simulations (made for the PSE course)
via plain text data output.

Requirements
This script requires Python 3 and Pygame.
Tested with:
- Python 3.8.10
- Pygame 2.1.2
- Ubuntu 20.04
You can install Pygame using pip3 install pygame or similar.
Usage
The script reads its data from stdin before launching the visualization. The
text data format is described below.
You can use the following
command to pipe the output of your simulation to the visualizer (assuming
./trafficsimulation runs the simulation and writes its output to stdout):
./trafficsimulation | python3 visualize.py
Use --help to get an overview of all available options: