Creating publication-quality figures with Matplotlib
matplotlib_for_papers
Handout for the tutorial “Creating publication-quality figures with matplotlib”
This repository contains the handout (and the source of the handout) for the tutorial “Creating publication-quality with Python and Matplotlib”, given at the Alife 2014 conference.
Contributions are welcomed: feel free to clone and send pull requests.
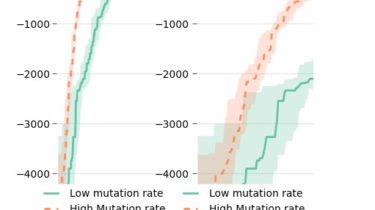
Examples of figures:
Reference
Tonelli, Paul, and Jean-Baptiste Mouret. “On the relationships between generative encodings, regularity, and learning abilities when evolving plastic artificial neural networks.” PloS one 8.11 (2013): e79138.

Reference
Clune*, Jeff, Jean-Baptiste Mouret*, and Hod Lipson. “The evolutionary origins of modularity.” Proceedings of the Royal Society B: Biological sciences 280.1755 (2013): 20122863 [*: equal contribution].


What is Matplotlib?