Resources for teaching & learning practical data visualization with python

Practical Data Visualization with Python This repository contains all materials related to a lecture / seminar I teach on practical data visualization with python. What I mean by “practical” is that the materials herein do not focus on one particular library or data visualization method; rather, my goal is to empower the consumer of this content with the tools, heuristics, and methods needed to handle a wide variety of data visualization problems. If you have questions, comments, or suggested alterations […]

Read more
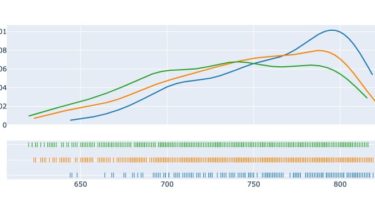
A Python library that allows for effortless profiling with high-quality visualizations

QuickPotato A library for the Python programming language that allows for effortless profiling with high-quality visualizations and empowers you to produce a performance angle to test-driven development. QuickPotato is a Python library that aims to make it easier to rapidly profile your software and produce powerful code visualizations that enables you to quickly investigate where potential performance bottlenecks are hidden. Also, QuickPotato is trying to provide you with a path to add an automated performance testing angle to your regular […]

Read more

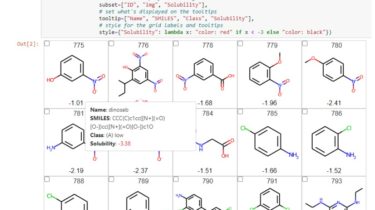
An interactive chemical viewer for 2D structures of small molecules

mols2grid mols2grid is an interactive chemical viewer for 2D structures of small molecules, based on RDKit. 🐍 Installation mols2grid was developped for Python 3.6+ and requires rdkit (>=2019.09.1), pandas and jinja2 as dependencies. To install mols2grid from a clean conda environment: conda install -c conda-forge ‘rdkit>=2019.09.1’ pip install mols2grid It is compatible with Jupyter Notebook and Google Colab (Visual Studio notebooks and Jupyterlab are not supported) and can run on Streamlit. 📜 Usage import mols2grid mols2grid.display(“path/to/molecules.sdf”, # RDKit’s MolDrawOptions parameters […]

Read more

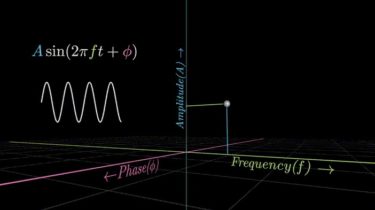
Make scripted visualizations in blender with python

Scripted visualizations in blender The goal of this project is to script 3D scientific visualizations using blender. To achieve this, we aim to bring together blender’s powerful visualization toolkit with Anaconda’s scientific computing and package management capabilities. For example, the code in ./apps/concepts/fourier_signal_composition.py was used to generate the following visualization. Acknowledgments All the wonderful people that make open source software Inspiration – 3blue1brown’s videos and pedagogical clarity Setup instructions These are detailed instructions that worked for me on a windows […]

Read more

A Comprehensive Step-by-Step Guide to Become an Industry Ready Data Science Professional

Introduction to Artificial Intelligence and Machine Learning Artificial Intelligence (AI) and its sub-field Machine Learning (ML) have taken the world by storm. From face recognition cameras, smart personal assistants to self-driven cars. We are moving towards a world enhanced by these recent upcoming technologies. It’s the most exciting time to be in this career field! The global Artificial Intelligence market is expected to grow to $400 billion by the year 2025. From Startups to big organizations, all want to join […]

Read more

Hands-On Tutorial on Stack Overflow Question Tagging

This article was published as a part of the Data Science Blogathon. Background I won’t be lying if I assert that every developer/engineer/student has used the website Stack Overflow more than once in their journey. Widely considered as one of the largest and more trusted websites for developers to learn and share their knowledge, the website presently hosts in excess of 10,000,000 questions. In this post, we try to predict the question tags based on the question text asked on […]

Read more

A Comprehensive Step-by-Step Guide to Become an Industry-Ready Data Science Professional

Introduction to Artificial Intelligence and Machine Learning Artificial Intelligence (AI) and its sub-field Machine Learning (ML) have taken the world by storm. From face recognition cameras, smart personal assistants to self-driven cars. We are moving towards a world enhanced by these recent upcoming technologies. It’s the most exciting time to be in this career field! The global Artificial Intelligence market is expected to grow to $400 billion by the year 2025. From Startups to big organizations, all want to join […]

Read more

Build a word cloud using text mining tools of R

 This is how a word cloud of our entire website looks like! A word cloud is a graphical representation of frequently used words in a collection of text files. The height of each word in this picture is an indication of frequency of occurrence of the word in the entire text. By the end of this article, you will be able to make a word cloud using R on any given set of text files. Such diagrams are very useful when doing […]

Read more

6 Exciting Open Source Data Science Projects you Should Start Working on Today

Overview Here are six open-source data science projects to enhance your skillset These projects cover a diverse set of domains, from computer vision to natural language processing (NLP), among others Pick your favorite open-source data science project(s) and get coding!   Introduction I recently helped out in a round of interviews for an open data scientist position. As you can imagine, there were candidates from all kinds of backgrounds – software engineering, learning and development, finance, marketing, etc. What stood […]

Read more
1 2 3