Create Vega/Vega-Lite dashboards for Datasette

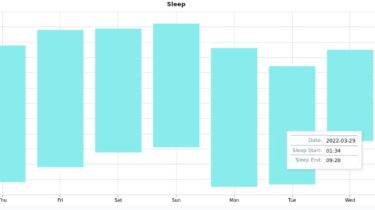
Build custom Vega/Vega-Lite dashboards in Datasette, for presentation-ready plots and visualizations. Installation Install this plugin in the same environment as Datasette. $ datasette install datasette-vega-dashboards Tutorial See the example fixture in example_fixture for a minimal example. You can run the fixture via: datasette -m metadata.json –template-dir templates/ sleep_log.db and then open http://127.0.0.1:8001/sleep_log/read_sleep to see the dashboard. In the minimal example, we create a canned query in metadata.json:

Read more

The ifm_stoestring_hackthon with a machine energy monitoring system for the low carbon economy

In our solution based on plotly, dash and influxdb, the user will firstly generate the specifications for different robots, and then a wide range of interactive visualizations for different machines for machine power, machine cost, and total cost based on the energy time and total energy getting dynamically from sensors. If a threshold is met, the alert email is generated for further operation. Introduction dash-manufacture-spc-dashboard is a dashboard for monitoring read-time process quality along manufacture production line.This is a demo […]

Read more

A dashboard that shows the detailed information about each book in the top 50 best selling books on amazon over the last ten years

It’s a dashboard that shows the detailed information about each book in the top 50 best selling books on amazon over the last ten years Table of contents: 1-General info 2-Setup General info In this project,we implement a dashboard that shows the detailed information about each book in the top 50 best selling books on amazon over the last ten years.when the user clicks on a book in the graph , all the information about it appear. Setup To run […]

Read more

An interactive dashboard built with python that enables you to visualise how rent prices differ across Sweden

An interactive dashboard built with python that enables you to visualise how rent prices differ across Sweden. The dashboard/web-app generated from this project can be viewed by clicking here The dashboard was built to be highly interactive so please do feel free to interact with the figures, dialog buttons, sliders and text inputs. (Unfortunately, the web-app does not render well on mobile devices.) Preview of the Dashboard Overview Page Code and Resources Used Python Version: 3.8 Packages Used: pandas, numpy, […]

Read more