Better Understand Your Data in R Using Visualization (10 recipes you can use today)

Last Updated on August 22, 2019
You must understand your data to get the best results from machine learning algorithms.
Data visualization is perhaps the fastest and most useful way to summarize and learn more about your data.
In this post you will discover exactly how you can use data visualization to better understand or data for machine learning using R.
This post is perfect if you are a developer and are just starting using R for machine learning, or looking to get started.
Follow along or use the R recipes in this post in your current or next project.
Kick-start your project with my new book Machine Learning Mastery With R, including step-by-step tutorials and the R source code files for all examples.
Let’s get started.

Better Understand Data in R Using Visualization
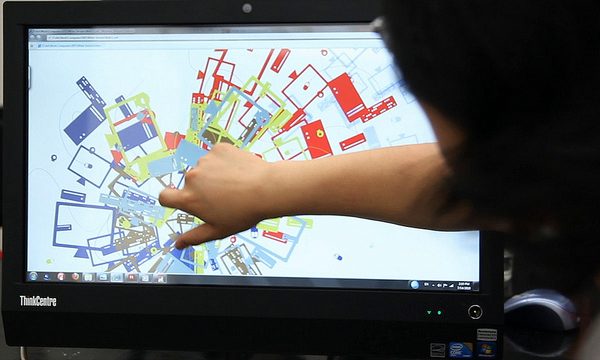
Photo by Cory M. Grenier, some rights reserved.
Understand Your Data To Get The Best Results
A better understanding of your data will yield better results from machine learning algorithms.
You will be able to
To finish reading, please visit source site