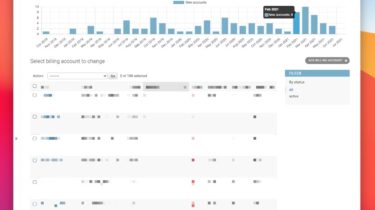
Add Chart.js visualizations to Django admin using a mixin class in python

django-admincharts
Add Chart.js visualizations to your Django admin using a mixin class.
Example
from django.contrib import admin

from .models import BillingAccount
from admincharts.admin import AdminChartMixin
from admincharts.utils import months_between_dates


@admin.register(BillingAccount)
class BillingAccountAdmin(AdminChartMixin, admin.ModelAdmin):
    def get_list_chart_data(self, queryset):
        if not queryset:
            return {}

        # Cannot reorder the queryset at this point
        earliest = min([x.ctime for x in queryset])

        labels = []
        totals = []
        for b in months_between_dates(earliest, timezone.now()):
            labels.append(b.strftime("%b %Y"))
            totals.append(
                len(
                    [
                        x
                        for x in queryset
                        if x.ctime.year == b.year and x.ctime.month == b.month
                    ]
                )
            )

        return {
            "labels": labels,
            "datasets": [
                {"label": "New accounts", "data": totals, "backgroundColor": "#79aec8"},
            ],
        }
Installation
Install from pypi.org:
$ pip install django-admincharts
Add admincharts to your Django INSTALLED_APPS:
INSTALLED_APPS = [
    ...
    "admincharts",
]