A dashboard that shows the detailed information about each book in the top 50 best selling books on amazon over the last ten years
It’s a dashboard that shows the detailed information about each book in the top 50 best selling books on amazon over the last ten years
Table of contents:
1-General info
2-Setup
General info
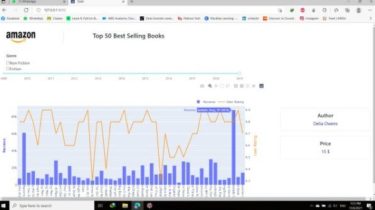
In this project,we implement a dashboard that shows the detailed information about each book in the top 50 best selling books on amazon over the last ten years.
when the user clicks on a book in the graph , all the information about it appear.
Setup
To run this project, install :
1- dash library
2- plotly.express library
3- plotly.graph_objects library
4- dash_bootstrap_components library
5- numpy library
6- pandas library