An interactive dashboard built with python that enables you to visualise how rent prices differ across Sweden
An interactive dashboard built with python that enables you to visualise how rent prices differ across Sweden.
The dashboard/web-app generated from this project can be viewed by clicking here The dashboard was built to be highly interactive so please do feel free to interact with the figures, dialog buttons, sliders and text inputs. (Unfortunately, the web-app does not render well on mobile devices.)
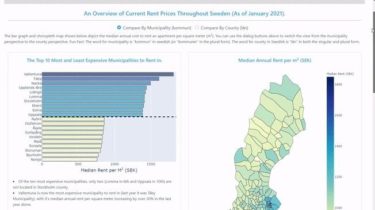
Preview of the Dashboard Overview Page

Code and Resources Used
- Python Version: 3.8
- Packages Used: pandas, numpy, json, dash, plotly, BeautifulSoup, requests, urllib.request (Those that are required for hosting the web-app can be installed using: pip install -r requirements.txt after cloning the repo).
- Statistical Data: Downloaded from