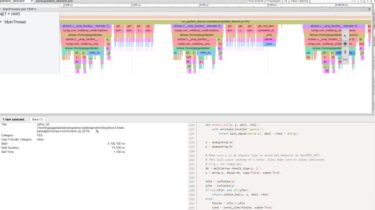
A low-overhead logging/debugging/profiling tool that can trace and visualize

VizTracer
VizTracer is a low-overhead logging/debugging/profiling tool that can trace and visualize your python code execution.
You can take a look at the demo result of multiple example programs. The UI is powered by Chrome Trace Viewer. Use “AWSD” to zoom/navigate. More help can be found by clicking “?” on the top right corner.
Highlights
- Detailed function entry/exit information on timeline with source code
- Super easy to use, no source code change for most features, no package dependency
- Optional function filter to ignore functions you are not interested
- Custom events to log and track arbitrary data through time
- Log arbitrary function/variable using RegEx without code change
- Stand alone HTML report with powerful front-end, or chrome-compatible json
- Works on Linux/MacOS/Windows
Install
The prefered way to install VizTracer is